We can use Monte Carlo simulations to get a sense of when something will land based on Story points, as described at https://www.scrum.org/resources/blog/monte-carlo-forecasting-scrum
Example This is the example from the blog above
| Sprint | 4 | 6 | 7 | 8 | 10 | 11 | 12 |
|---|---|---|---|---|---|---|---|
| # Days | 10 | 10 | 10 | 10 | 10 | 10 | 10 |
| # Points | 114 | 143 | 116 | 109 | 127 | 153 | 120 |
| Days / Point | .087 | .069 | .086 | .091 | .078 | .065 | .083 |
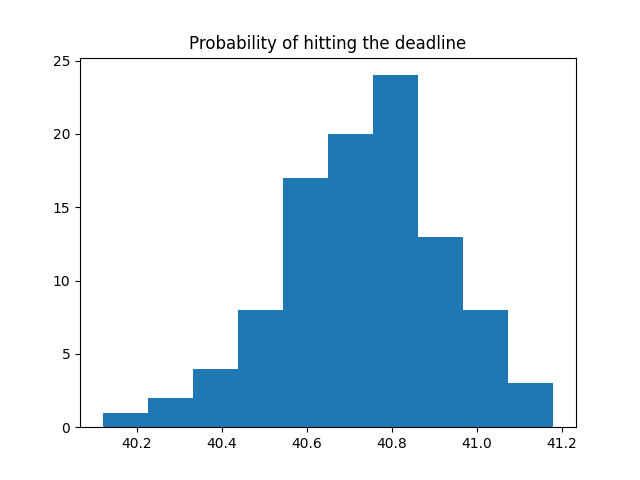
| Backlog size: 510 Naive answer is avg 126 points / sprint.. 510/126 = 4.04 sprints = 40.47 days. |
import numpy as np
import random
days_per_point = [.087, .069, .086, .091, .078, .065, .083]
backlog_size = 510

def days_to_complete_backlog(backlog_size):
	duration = 0
	for i in range(backlog_size):
		duration += random.choice(days_per_point)
	return duration

num_iterations = 100
predictions = [days_to_complete_backlog(backlog_size) for _ in range(num_iterations)]

import matplotlib.pyplot as plt
plt.hist(predictions, bins='auto')  # arguments are passed to np.histogram
plt.title("Probability of hitting the deadline")
plt.show()